50m splits in 200m races
The 200m has always been one of my favourite events to watch because of how technical it is and the combination of speed and speed endurance/maintenance that is needed to succeed in it. Therefore I decided to take a deeper look at the available 50m splits from sub-20 seconds 200m performances. The reason for looking at 50m splits rather than 100m splits is because I believe that the 50m splits tells a more complete and detailed story than the 100m splits does. I looked at a number of things such as how each individual sprinter compared to the median result of these splits during the different 50m segments and the relative slowdown of each sprinter between the 50-100m segment and the 150-200m segment.
First I will post a list of
the 50m splits that I could find from sub-20 seconds 200m performances. The
majority of the splits are taken from the
https://www.athletefirst.org/?page_id=387 webpage. In the list here below I did
however cite the original source instead of that page.
Eugene Diamond League 2023
Andre De Grasse
5.83+4.51+4.59+4.83=19.76
Kenny Bednarek 5.78+4.48+4.64+5.05=19.95
Erriyon Knighton 5.82+4.48+4.62+5.05=19.97
https://static.sportresult.com/sports/at/data/2023/eugene/ATHM200M----DIAMOND---FNL-000100--_C77A_1.0.PDF
Brussels Diamond League
2023
Kenny Bednarek
5.73+4.43+4.64+4.99=19.79
Zharnel Hughes 5.78+4.44+4.60+5.00=19.82
Andre De Grasse 5.84+4.50+4.63+4.92=19.89
Aaron Brown 5.82+4.53+4.66+4.97=19.98
https://static.sportresult.com/sports/at/data/2023/brussels/ATHM200M----DIAMOND---FNL-000100--_C77A_1.0.PDF
Zurich Diamond League 2023
Noah Lyles:
5.76+4.44+4.66+4.94=19.80
Erriyon Knighton: 5.76+4.46+4.66+4.99=19.87
Zharnel Hughes: 5.81+4.45+4.65+5.03=19.94
Kenny Bednarek: 5.78+4.46+4.68+5.06=19.98
https://static.sportresult.com/sports/at/data/2023/zurich/ATHM200M----DIAMOND---FNL-000100--_C77A_1.0.PDF
London Diamond League 2023
Noah Lyles:
5.77+4.42+4.51+4.77=19.47
Letsile Tebogo: 5.77+4.46+4.54+4.73=19.50
Zharnel Hughes: 5.76+4.44+4.55+4.98=19.73
https://static.sportresult.com/sports/at/data/2023/london/ATHM200M----DIAMOND---FNL-000100--_C77A_1.0.PDF
Oslo Diamond League 2023
Erriyon Knighton:
5.81+4.46+4.64+4.86=19.77
https://static.sportresult.com/sports/at/data/2023/oslo/ATHM200M----DIAMOND---FNL-000100--_C77A_1.0.PDF
2022 Diamond League Zurich
Noah Lyles:
5.72+4.41+4.58+4.81=19.52
https://livecache.sportresult.com/node/binaryData/ATH_PROD/ZURICH2022/PDF_ATHM200M----DIAMOND---FNL-000100--_C78.PDF?h=oOf18FX3gvz3Z/Z7LrLJqll9sVo=
2022 Diamond League
Lausanne
Noah Lyles:
5.76+4.39+4.55+4.86=19.56
Michael Norman: 5.62+4.47+4.68+4.99=19.76
Jereem Richards: 5.78+4.51+4.67+4.99=19.95
https://livecache.sportresult.com/node/binaryData/ATH_PROD/LAUSANNE2022/PDF_ATHM200M----DIAMOND---FNL-000100--_C78.PDF?h=PuD6HPIpN/EgDCyn4YHXlnC7e0Y=
Paris Diamond League 2022
Luxolo Adams:
5.83+4.50+4.60+4.89=19.82
Omega Timing (2022) -
diamond league race analysis
Monaco Diamond League 2022
Noah Lyles:
5.74+4.39+4.58+4.75=19.46
Erriyon Knighton: 5.78+4.43+4.65+4.98=19.84
Michael Norman: 5.71+4.52+4.74+4.98=19.95
Omega Timing (2022) -
diamond league race analysis
2019 World Championships
Doha
Noah Lyles:
5.83+4.49+4.57+4.94=19.83
Andre De Grasse: 5.79+4.50+4.67+4.99=19.95
Alex Quiñónez: 5.91+4.54+4.62+4.91=19.98
Takahashi (2019) - race
analysis top 200m athletes- domestic and international
2019 Seiko Golden Grand
Prix Osaka
Michael Norman:
5.67+4.47+4.71+4.99=19.84
Hirokawa (2019) - research
on athlete performance and technique- 2019 data book
2018 Seiko Golden Grand
Prix Osaka
Isaac Makwala:
5.86+4.51+4.70+4.89=19.96
Takahashi (2018) - 200m
Running Performance Analysis of Top Athletes in 2018
2016 Olympics Rio Final
Usain Bolt:
5.67+4.46+4.64+5.01=19.78
Takahashi (2016) -
performance analysis of the top 200m sprinters in japan & abroad
2016 Olympics Rio Semifinals
Usain Bolt:
5.71+4.49+4.63+4.95=19.78
Andre De Grasse: 5.77+4.54+4.63+4.86=19.80
Takahashi (2016) -
performance analysis of the top 200m sprinters in japan & abroad
2015 World Championships
Beijing Final
Usain Bolt:
5.67+4.38+4.57+4.93=19.55
Justin Gatlin: 5.62+4.51+4.64+4.97=19.74
Anoso Jobodwana: 5.82+4.49+4.61+4.95=19.87
Takahashi (2015) - 200m
race analysis of Japanese and the World best of 2015
2015 World Championships
Beijing Semifinals
Justin Gatlin:
5.63+4.52+4.68+5.04=19.87
Usain Bolt: 5.75+4.53+4.61+5.06=19.95
Takahashi (2015) - 200m
race analysis of Japanese and the World best of 2015
2012 Olympics London
Usain Bolt: 5.62+4.36+4.49+4.85=19.32
Artur Pastor Garcia,
https://radunga-dejandohuella.blogspot.com/
2011 World Championships
Daegu (KSSB version)*
Usain Bolt:
5.53+4.44+4.57+4.86=19.40
Walter Dix: 5.59+4.52+4.64+4.95=19.70
Christophe Lemaitre: 5.65+4.59+4.67+4.89=19.80
KSSB (2011) - biomechanical
analyis of men's 200m (final)
2011 World Championships
Daegu (Alternative and likely more accurate version, estimated 0-50m and
50-100m splits based on the 55m split)*
Usain
Bolt: 5.64e+4.33e+4.57+4.86=19.40
Walter Dix: 5.71e+4.40e+4.64+4.95=19.70
Christophe Lemaitre: 5.76e+4.48e+4.67+4.89=19.80
https://forum.trackandfieldnews.com/forum/current-events/42010-daegu-mens-200m-splits
2009 World Championships
Berlin
Usain Bolt:
5.60+4.32+4.52+4.75=19.19
Alonso Edward: 5.88+4.49+4.63+4.81=19.81
Wallace Spearmon: 5.89+4.53+4.64+4.79=19.85
Shawn Crawford: 5.73+4.42+4.65+5.09=19.89
Steve Mullings: 5.70+4.50+4.73+5.05=19.98
Graubner (2009) -
biomechanical analyses at the 12th IAAF world championships
2008 Olympics Beijing
Usain Bolt:
5.63+4.35+4.54+4.78=19.30
Artur Pastor Garcia,
https://radunga-dejandohuella.blogspot.com/
2008 USA Olympic Trials
Eugene
Walter Dix:
5.77+4.53+4.64+4.92=19.86
Shawn Crawford: 5.78+4.51+4.63+4.94=19.86
Wallace Spearmon: 5.97+4.57+4.64+4.72=19.90
Rodney Martin: 5.82+4.57+4.71+4.89=19.99
USATF Women's Sprint
Development with HPC (2008)
2007 World Athletic Final
Stuttgart
Jaysuma Saidy Ndure:
5.81+4.53+4.65+4.90=19.89
Graubner (2007) -
https://www.fgs.uni-halle.de
2007 World Championships
Osaka
Tyson Gay:
5.74+4.39+4.62+5.01=19.76
Usain Bolt: 5.69+4.46+4.70+5.06=19.91
Ae (2008) - IAAF
biomechanics team - a booklet of biomechanics data
2006 World Athletic Final
Stuttgart
Tyson Gay:
5.68+4.37+4.64+4.99=19.68
Wallace Spearmon: 5.83+4.50+4.61+4.94=19.88
Graubner (2008) -
https://www.fgs.uni-halle.de
2006 USATF National
Championship Indianapolis
Wallace Spearmon:
5.97+4.57+4.64+4.72=19.90
Jordan Vaden: 5.82+4.57+4.70+4.89=19.98
USATF Women's Sprint
Development (2006)
2004 USA Olympic Trials
Sacramento
Shawn Crawford:
5.72+4.53+4.62+5.12=19.99
USATF Women's Sprint
Development (2004)
2002 European Championships
Munich
Konstantinos Kenteris:
5.75+4.54+4.64+4.92=19.85
Graubner (2009) -
https://www.fgs.uni-halle.de
1999 World Championships
Seville
Maurice Greene:
5.74+4.51+4.69+4.96=19.90
Ferro (2001) -
biomechanical analysis of the 7th world championships, seville 1999
1996
Olympics Atlanta**
Michael
Johnson: 5.79+4.35+4.48+4.70=19.32
Frankie Fredericks: 5.81e+4.38e+4.61+4.88=19.68
Ato Boldon: 5.82e+4.36e+4.66+4.96=19.80
Maisetti (1996) -
observation des courses de vitesse d'Atlanta
Veney - split times from PJ
https://forum.trackandfieldnews.com/forum/historical/4284-question-for-the-stat-o-holics
1996 DLV Leichtathletik-Gala
Duisburg
Frankie Fredericks:
5.85+4.52+4.69+4.90=19.96
Graubner (2008) -
https://www.fgs.uni-halle.de
1993 World Championships
Stuttgart
Frankie Fredericks:
5.86+4.53+4.60+4.86=19.85
John Regis: 5.84+4.44+4.65+5.01=19.94
Graubner (2008) -
https://www.fgs.uni-halle.de
1988 Olympics Seoul
Joe DeLoach: 5.81+4.54+4.62+4.78=19.75
Carl Lewis: 5.76+4.55+4.66+4.82=19.79
Brüggemann (1990) -
scientific research project at the games of the XXXIV Olympiad
* I think that the 100m
splits in the KSSB version of the 2011 World Championships final are somewhat
accurate but there is no way that the first two 50m splits are anywhere close
to accurate. The combination of Bolt having a 5.53 split over the first 50
metres in spite of a 0.193 reaction time and the 5.59 and 5.65 splits of Dix
and Lemaitre makes me feel fairly certain that those 50m splits are
significantly off. The 55m split times posted in the thread on this forum seem
far more accurate and because of that I decided to use estimated 0-50m and
50-100m segment splits based on those 55m splits. The estimated split times may
not be perfect either but I believe that they are much closer to the
"truth" than the KSSB 50m splits are. Bolt, Dix and Lemaitre went
through 55 metres in 6.08, 6.15 and 6.21 seconds. They then passed the 100m
mark in 9.97, 10.11 and 10.24 seconds which means that they ran the 55-100m
segment in 3.89, 3.96 and 4.03. That means that they on average ran every metre
of that segment in 0.08644, 0.088 and 0.08955 seconds. Over 50 metres those
one-metre averages give times of 4.322, 4.40 and 4.477. Rounding up like it is
customary to do in sprinting would give 50-100m segments of 4.33, 4.40 and 4.48
which puts the first 50m splits at 5.64, 5.71 and 5.76. Like I said these estimates
may not be perfect but I am still convinced that they are far more accurate
than the 5.53, 5.59 and 5.65 splits are.
** In the main source for
the 1996 Olympic final all four 50m split times of Johnson are available but
when it comes to Fredericks and Boldon only the first 100m splits and the last
two 50m splits are available. For the first two 50m splits of Fredericks and
Boldon I instead used the estimated split times from the poster The King on
this forum. The positive thing is that all of the 100m splits from the two
sources match each other and the first two 50m splits of Johnson are the same
in both sources. This suggests to me that the estimated first two 50m splits of
Fredericks and Boldon should be relatively accurate as well.
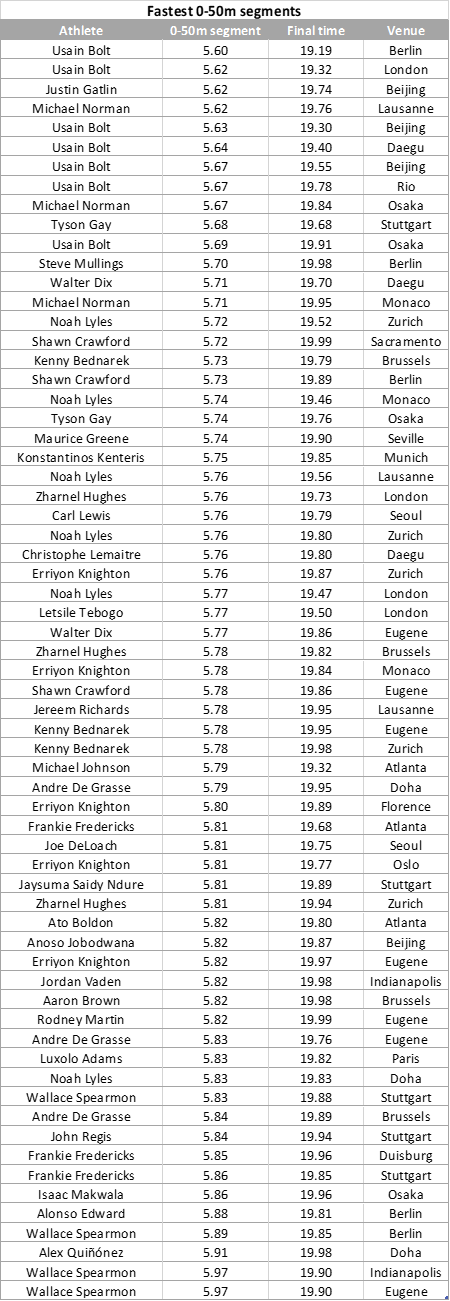
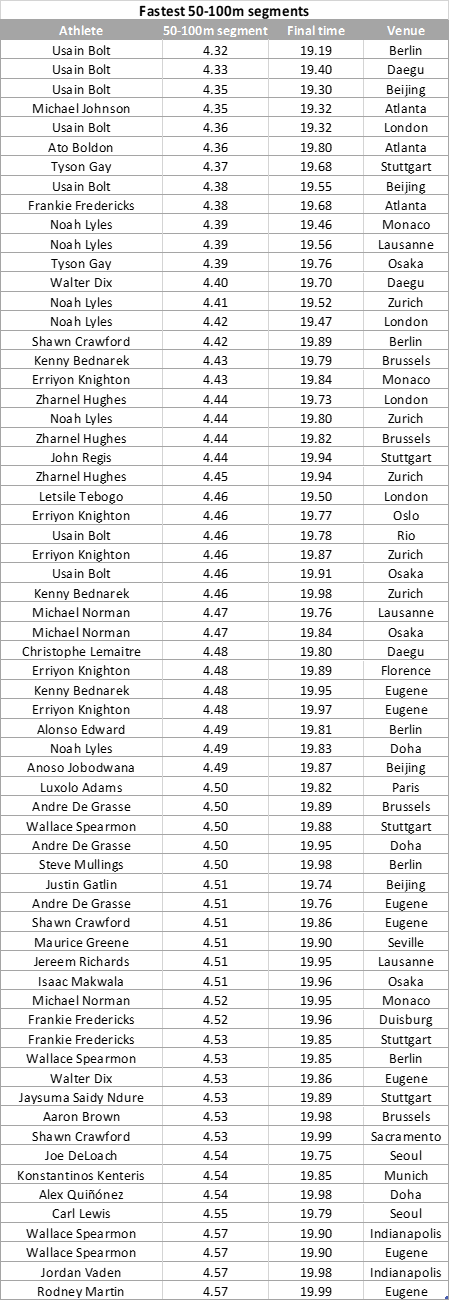
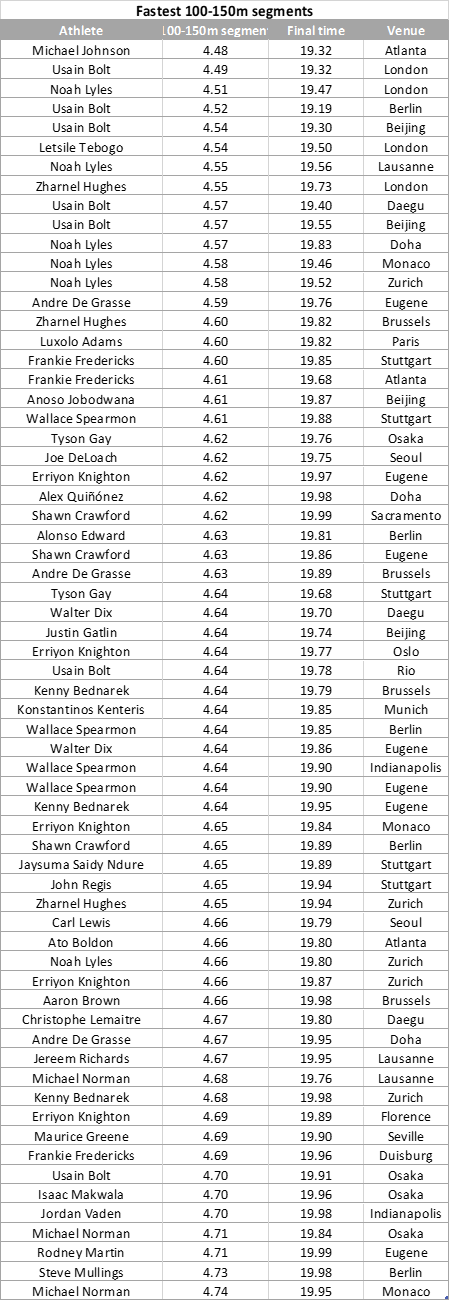
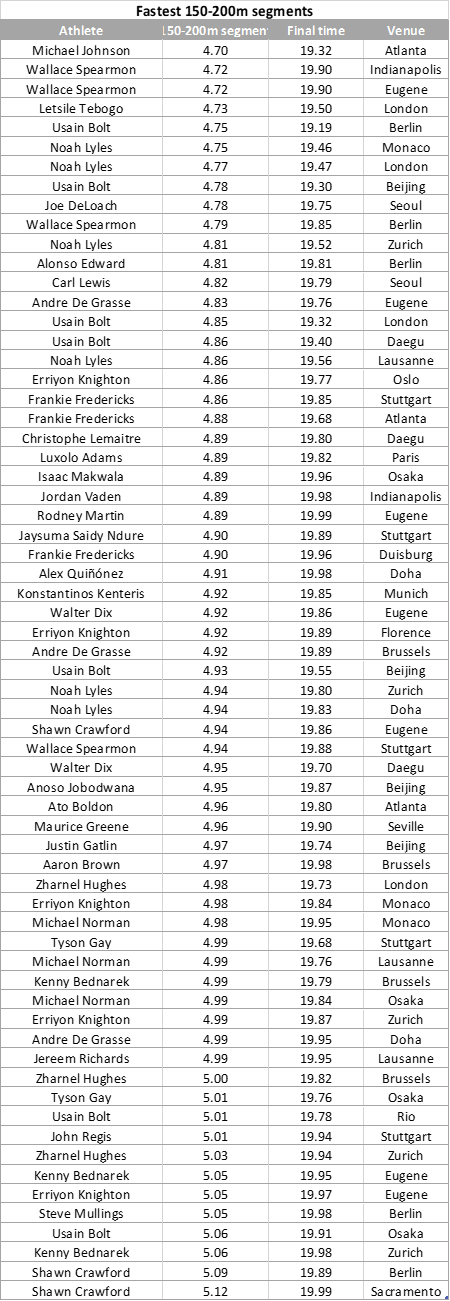
Here are the lists of the best
results per segment and the median results. I did not include the four sub-20
semifinal performances from which I have found 50m splits (Bolt 19.78 - 2016,
De Grasse 19.80 - 2016, Gatlin 19.87 - 2015 and Bolt 19.95 - 2015) in this
analysis. The reason for not including them is that I did not want to include
performances where the sprinter clearly shut things down during the last 50m
segment which (to varying degrees) was the case in a number of those semifinal
performances.
Here is how each individual sprinter compares to the median results.
Usain Bolt


Michael Johnson

Noah Lyles


Letsile Tebogo

Tyson Gay


Frankie Fredericks


Walter Dix


Zharnel Hughes


Justin Gatlin

Joe DeLoach

Michael Norman


Andre De Grasse


Erriyon Knighton


Kenny Bednarek


Carl Lewis

Ato Boldon

Christophe Lemaitre

Alonso Edward

Luxolo Adams

Wallace Spearmon


Konstantinos Kenteris

Shawn Crawford


Anoso Jobodwana

Jaysuma Saidy Ndure

Maurice Greene

John Regis

Jereem Richards

Isaac Makwala

Steve Mullings

Jordan Vaden

Alex Quiñónez

Aaron Brown

Rodney Martin

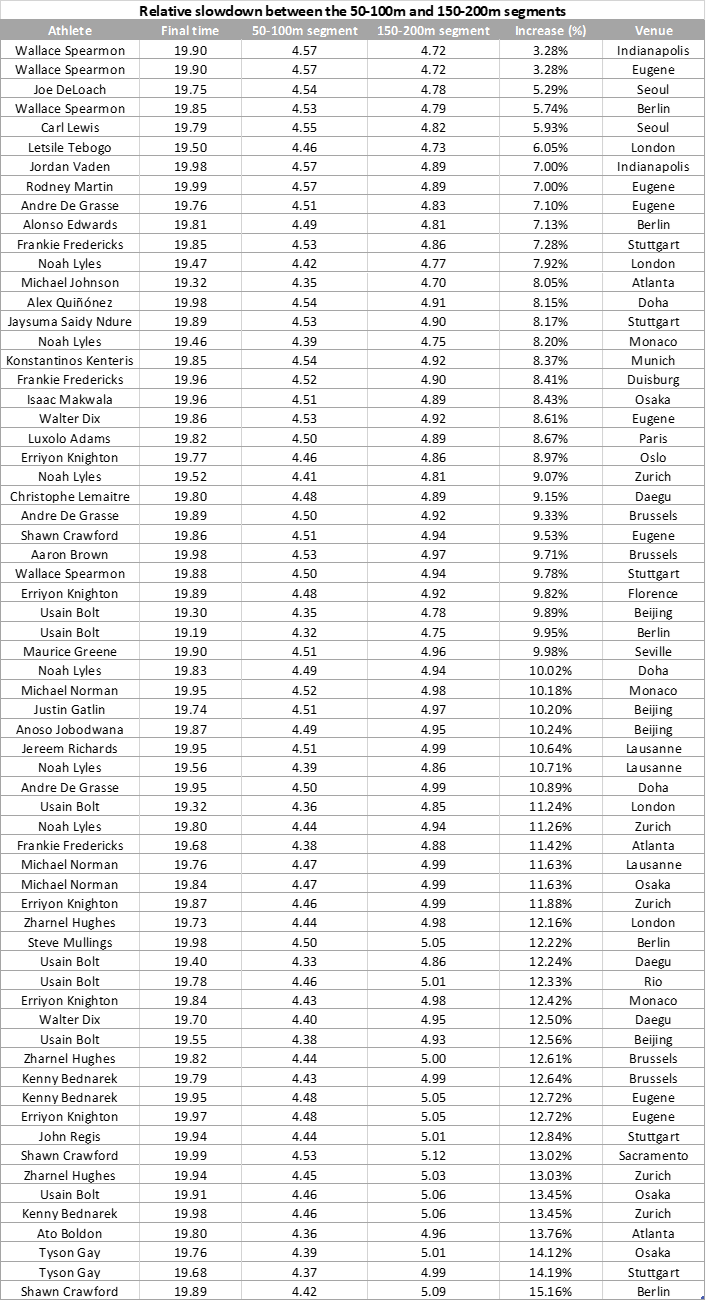
One thing that stands out is that Usain Bolt was at least 0.10 seconds faster than the median result during every 50m segment in his two best races of 19.19 and 19.30. In his 19.19 performance Bolt was in fact between 0.12 and 0.18 seconds faster than the median during every 50m segment. No other sprinter in history has been that outstanding during every part of the race and in order to break the 19.19 record I believe that the sprinter in question will have to master every part of the race to a similar degree as Bolt did at his peak. To take an example of this I would point out that Michael Johnson in his 19.32 race was 0.13s (50-100m), 0.16s (100-150m) and 0.23s (150-200m) faster than the median results and still significantly behind the 19.19 mark due to being slightly slower than the median result over the first 50m segment. So even if Bolt clearly was showing signs of fatigue during the last 50 metres of his 19.19 race the first 50m segment of Johnson was a far more significant weakness than the last 50m segment of peak Bolt was. Most sprinters have to sacrifice some time during either the 0-50m segment or the 150-200m segment. If you run the first 50 metres hard that will likely catch up to you to a certain degree during the last 50 metres and if you on the other hand hold back much during the first 50 metres that lost time will be very difficult to recover later in the race. An example of this is that outside of Bolt none of the sprinters that have run a sub-5.7 first 50m segment (Gatlin, Norman and Gay) have also run a sub-4.97 last 50m segment in the same race as their sub-5.7. With this in mind it is pretty amazing that Bolt at his peak managed to be at least 0.12 seconds faster than the median during every 50m segment.
There is however no doubt about that the first two 50m segments are where Bolt excelled the most. The 4.32 split between 50 and 100 metres means that Bolt during that segment averaged 0.864s per 10 metres in spite of being restricted by the curve. However while the 50-100m segment probably was the most impressive I also think that one of the main keys to the 19.19 performance was the first 50m segment and in particular his outstanding start which meant that he was able to run rather relaxed and still pass the 50m mark in 5.60 seconds. Because if we discount the reaction times Bolt actually ran the first 50 metres somewhat slower (5.47) in his 19.19 race than he did in his second, third and fourth fastest races (5.44 in the 19.32 and 5.45 in the 19.30 and 19.40) which suggests that he may have been able to save some energy over the first 50 metres and still end up with an incredible 5.60 split. That slightly more relaxed first 50m segment may also have played a part in that Bolt then managed to run the 50-200m segment significantly faster (13.59) than he did in those other races (13.67 in the 19.30, 13.70 in the 19.32 and 13.76 in the 19.40).
Bolt had a sub-5.7 first 50m split in every single one of his seven races that are included in this study. In retrospect it is also easy to view his 5.69 split on the way to a 10.15 curve during the 19.91 in the 2007 World Championships final as something that would have made it possible to predict some of his 100m success from 2008 and onwards. The biggest difference between Bolt at his absolute peak in 2008-2009 and the rest of his career is how much better he maintained his speed during his peak years.
Noah Lyles is the only other sprinter that has managed to run faster than the median during every 50m segment more than once. Lyles has probably done that five times (we know that he has done it at least four times and he most likely also did it in his 19.31 performance) which is one more than even Usain Bolt who had four such performances. It did surprise me that his first 50m segment in the 19.56 performance was as fast as 5.76 considering how he got left in the blocks by Michael Norman. But when we consider that Norman had one of the greatest first 50 metres of all time in that race it may be a case of that the great start of Norman made Lyles start seem slower than it actually was.
In his 19.50 performance Letsile Tebogo became the third sprinter to run every 50m segment faster than the median result.
Michael Johnson had a 4.67% decrease compared to the median during the 150-200m segment, a 3.45% decrease during the 100-150m segment and a 2.9% decrease during the 50-100m segment which gives him the fastest 50-200m split of the sprinters in this study (13.53). In the 19.26 race Yohan Blake almost certainly ran the 50-200m segment even faster than Johnson though.
Outside of Bolt, Tyson Gay was the only sprinter who had a sub-5.7 and a sub-4.4 split in the same race (19.68). After those 5.68 and 4.37 splits on the curve Gay also matched the median of 4.64 during the 100-150m segment. That very fast 150 metres of 14.69 really caught up to him during the last 50 metres though where he only managed a 4.99 split. In both of his two races included in this study Gay ranked in the bottom three when it comes to slowdown between the 50-100m and 150-200m segments but thanks to him reaching such high top speeds during the 50-100m segments his finishing times were still very good. The splits of Tyson Gay is one of the reasons why I personally believe that the ability to hit a very high top speed during the 50-100m segment in spite of being restricted by the curve may be the most important quality of an elite 200m sprinter. Because if you manage to run the 50-100m segment faster than 4.40 you are going to be slowing down from such a high speed that even a steep slowdown can get you a 19.6-19.7 result (like in the case of Tyson Gay) and if your relative slowdown is on an above average level (like in the case of peak Bolt or peak Johnson) you will be able to get down to the 19.3 territory or even faster.
Unfortunately I have not found any 50m splits from Tyson Gay´s personal best of 19.58 but based on the 100m splits (10.08+9.50) and his 50m splits from the 19.68 and 19.76 my guesstimate is that his splits would look something like this 5.70+4.38+4.57+4.93.
The 19.70 of Walter Dix is another example of how important it is to reach a high top speed during the 50-100m segment. Because if we compare the relative slowdown between his 19.70 performance (12.5% increase) and his 19.86 performance (8.61% increase) it becomes rather clear that the main reason for why the 19.70 race still was significantly faster in spite of a much steeper slowdown is because Dix was slowing down from a much higher top speed in that race.
However while I personally believe that the ability to reach a very high top speed during the 50-100m segment may be the most important quality of the truly elite 200m sprinters there are exceptions to that as well. In the Olympic 200m final from 1988 both Joe DeLoach and Carl Lewis are examples of this with both of them having 50-100m splits in the mid-4.5s and still finishing with sub-19.8 clockings. Especially the splits pattern of Lewis is very unique considering that he was faster than the median during the 0-50m and 150-200m segments while he was slower than the median during the 50-100m and 100-150m segments.
Justin Gatlin and Michael Norman are the only two sprinters that have come close to matching Bolt during the 0-50m segment. That Norman is up there with Bolt and Gatlin (who both consistently had 60m splits in the 6.3s during their best 100m races) when it comes to the best starters in the 200m is pretty incredible considering that he first and foremost has been focusing on the 400m. It is also interesting to note how similar the splits of Norman are in his 19.76 (5.62+4.47+4.68+4.99) and 19.84 (5.67+4.47+4.71+4.99) races. I would guess that his personal best of 19.70 probably followed a very similar pattern as well. With the 400m prowess of Norman in mind it is interesting to note that the 0-50m segment clearly is his strongest and the 150-200m segment is his weakest. Part of that is likely by design though as I would guess that Norman probably runs the first 50m segment significantly harder than most other 200m sprinters and then counts on that he still will be able to avoid tying up completely during the last 50 metres thanks to his 400m strength.
That Gatlin had a 50m split of 5.62 in 2015 is far less surprising considering that he managed to achieve a 60m split of 6.35 in four of his 100m races that year. Gatlin also had a 5.63 split in the semifinal so he was consistently running outstanding first 50m segments at that point. The consistency of Gatlin in 2015 also makes it interesting to compare the 50m split in his 19.74 to his four fastest 60m splits in 100m races in order to get an idea of approximately how hard he ran during that 0-50m segment. If we take the 50m split of 5.62 and add an additional 10m split with the average speed of Gatlin during the 50-100m segment (0.902s) we get an estimated 60m split of around 6.52-6.53. So Gatlin likely passed the 60m mark around 0.17-0.18 seconds slower in his 19.74 than he did in his four fastest 100m races of that season. Doing the same estimate for the 19.19 performance of Bolt has him passing the 60m mark around 6.46-6.47 (5.60+0.864) which is around 0.15-0.16 seconds slower than his 60m split of 6.31 in the 9.58 from a few days earlier. So even the greatest 200m starters run the first 60 metres significantly slower than they do in their 100m races. Which is easy to understand considering the combination of the effects of running on the curve and that they have another 140 metres left to run after those first 60m.
Out of the sprinters included in this study Wallace Spearmon is clearly the one who maintained his speed the best. In his two 19.90 races Spearmon only slowed down 0.15 seconds between the 50-100m (4.57) and 150-200m (4.72) segments. It is however interesting to note that Spearmon slowed down significantly more in his two faster races (0.26s in the 19.85 and 0.44s in the 19.88) which suggests to me that he probably was holding back a bit too much on the curve in those 19.90 races. The 100m splits from the 19.65 race of Spearmon (10.20+9.45) also further suggests that.
The performance with the steepest slowdown is the 19.89 of Shawn Crawford as he ran the 150-200m segment 0.67 seconds slower than the 50-100m segment. Crawford was 0.05 seconds faster than the median during the 0-50m segment, 0.06 seconds faster during the 50-100m segment, 0.01 seconds slower during the 100-150m segment before he completely fell apart over the last 50 metres where he was 0.16 seconds slower than the median. That Crawford was running blind in lane 8 probably played a part in why he went out so hard in that race.
One thing that surprised me is that Andre De Grasse in his 19.95 silver medal performance had his two strongest 50m segments on the curve rather than on the home straight. In the other performances his splits are closer to what I expected with him instead having his strength during the 100-150m and 150-200m segments.
It is also interesting to be able to get a look at how Erriyon Knighton has compared to the median results of each segment. During the three first segments Knighton has performed on a similar level to the overall median result (there was never a bigger difference than 0.05 seconds between Knighton's result and the median of the 0-50m, 50-100m or 100-150m segments). When it comes to the 150-200m segment the results of Knighton has been more spread out on both sides of the median (in his 19.77 Knighton ran the last 50 metres 0.07 seconds faster than the median but in his 19.84, 19.87 and 19.97 he was 0.05, 0.06 and 0.12 seconds slower than the median). Knighton has therefore been rather consistent in his performances over the first 150 metres as he reached that mark in 14.86 (en route to 19.84), 14.88 (en route to 19.87), 14.91 (en route to 19.77), 14.92 (en route to 19.97) and 14.97 (en route to 19.89) and how well he handled the last 50m segment has really been the deciding factor for whether he managed to get a sub-19.8 result or instead ended up with a 19.8 or 19.9. Unfortunately there are only 100m splits from Knighton's outlier result of 19.49 but based on those splits (10.26+9.23) it seems like his first two 50m segments in that race were very similar to his performances in this study and that the difference instead came from significantly faster 100-150m and 150-200m segments.
When it comes to Zharnel Hughes it is very clear that the 50-100m and 100-150m segments are the strongest part of the race for him. During the 0-50m segment Hughes has performed on roughly the same level as the median result while the 150-200m segment clearly has been his weakness in the 200m. In his 19.73 Hughes reached the 150m mark in 14.75. Out of the sprinters in this study only Bolt, Johnson, Lyles, Gay and Dix have reached the 150m mark that fast or faster.
Kenny Bednarek ran a very impressive 10.16 curve during his 19.79 performance where he had 50m splits of 5.73+4.43. Then he matched the median of 4.64 during the 100-150m segment to get to the 150m mark in 14.80. That is as fast a 150m split as Frankie Fredericks had in his 19.68 performance. In the recent 19.67 of Bednarek he passed the 150m mark in 14.79 but in that race he held his speed much better as he ran the last 50 metres in 4.88 compared to the 4.99 of the 19.79 performance.
Among the results included in this study the current best results per segment are the 5.60 of Bolt, the 4.32 of Bolt, the 4.48 of Johnson and the 4.70 of Johnson. Based on the 9.12 second 100m split of Yohan Blake in his 19.26 he must have run one or both of the 50m splits faster than Johnson did in his 19.32 though. My guesstimate is that Blake ran the 100-150m segment somewhere around 4.47 and the 150-200m segment somewhere around 4.65. So assuming that this guesstimate is more or less accurate the best results per segment are actually closer to 5.60, 4.32, 4.47 and 4.65. How much faster than that is it possible to run each 50m segment with the current shoe and track technology? Before the primes of Bolt and Blake the best results per segment were the 5.68 of Gay, the 4.35 of Johnson, the 4.48 of Johnson and the 4.70 of Johnson so since 2007 the best 0-50m result has improved 0.08 seconds, the best 50-100m result has improved 0.03 seconds, the best 100-150m result has improved around 0.01 seconds and the best 150-200m result has improved around 0.05 seconds. But I believe that it will be difficult to make those kinds of improvements again in the near future simply because Bolt and Blake already have pushed the limits so far during the different parts of the race.
The fastest 100-150m segment in any race is the 4.44 of Bolt in his 14.35 world best straight track 150m. In that race Bolt ran a for his standard rather conservative first 50m split of 5.65 followed by a very fast 4.26 split between 50 and 100 metres. So the 4.44 split between 100 and 150 metres was part of a flying 100m split of 8.70 between the 50m mark and the finish line at 150 metres. That 8.70 is roughly on the same level as the fastest 4x100m anchor legs of all time. The combination of that Bolt could empty the tank completely during the 100-150m segment (since it was a 150m race) and that he was slowing down from a higher top speed (thanks to not being restricted by running on the curve) makes me think that it is highly unlikely that anyone in the near future will be able to run faster than 4.44 during the 100-150m segment in a 200m race on a curved track. So I think that it will be very difficult to run the 100-150m segment of a 200m race significantly faster than Blake and Johnson did (4.47-4.48 range).
150-200m is the segment where the best result is the furthest ahead of the median result whether we are talking about the 4.70 of Johnson (0.23 seconds ahead of the median) or the guesstimated 4.65 of Blake (0.28 seconds ahead of the median). With this in mind it seems like it will be very difficult to run that segment significantly faster than 4.65. In order to run that segment somewhere around 4.60 you would need to match what Frankie Fredericks did during the 100-150m segment in his 19.68 and 19.85 performances. That anyone will be able to maintain their speed well enough to be able to run the 150-200m segment as fast as a sprinter of Fredericks quality did during the 100-150m segment seems rather unlikely when taking into account how long the deceleration has been going on at that point of the race.
The fastest 50-100m segment in any race longer than 100 metres is the 4.20 split of Tyson Gay in his 19.41 straight track 200m. That means that Gay averaged 0.840s per 10 metres during that 50m segment which is the same average speed that is needed to run the last 40 metres of a 100m race in 3.36. That is something that only very few sprinters in history have managed to do. Gay was in fact not that far off his own fastest last 40 metres of a 100m race (3.31) which gives an average of 0.8275s per 10 metres. With this in mind I think that we can be relatively certain that no one in the near future will run anywhere close to a 4.20 split when being restricted by the curve in a 200m race. Just look at how much slower Usain Bolt ran during the 50-100m segment (4.32, 0.864s per 10m) in his 19.19 compared to his fastest last 40 metres of a 100m race (3.27, 0.8175s per 10m). The difference between the fastest 50-100m segment of Tyson Gay on a curved track (4.37, 0.874s per 10m) and his fastest last 40 metres of a 100m race (3.31, 0.8275s per 10m) is pretty much exactly the same as in the case of Bolt. Both Bolt and Gay were excellent curve runners as well so it is not as if they were more restricted by the curve than most other sprinters. So in order for someone to run a 4.29 split during the 50-100m segment of a 200m race that sprinter will likely have to be able to get something like a 3.24 split over the last 40 metres of a 100m race (0.810s per 10m).
It will not be easy to significantly improve on the 5.60 of Bolt either considering that he likely passed the 60m mark in around 6.46-6.47 seconds which would be a world class time even in a 60m dash. Most sprinters seem to run the first 60 metres of a 200m race between 0.11 and 0.22 seconds slower than what they are capable of running the 60m in which likely is due to a combination of the effects of running on the curve and that they hold back in order to not fall apart later in the race. In order to run the first 50 metres of a 200m race in something like 5.55 the sprinter in question will likely have to be capable of running the 60m dash somewhere in the high 6.2s unless he has a tendency to go much more all out than most sprinters do in the beginning of a 200m race.
Here are the fastest 0-150m segments from
performances with available 50m splits.
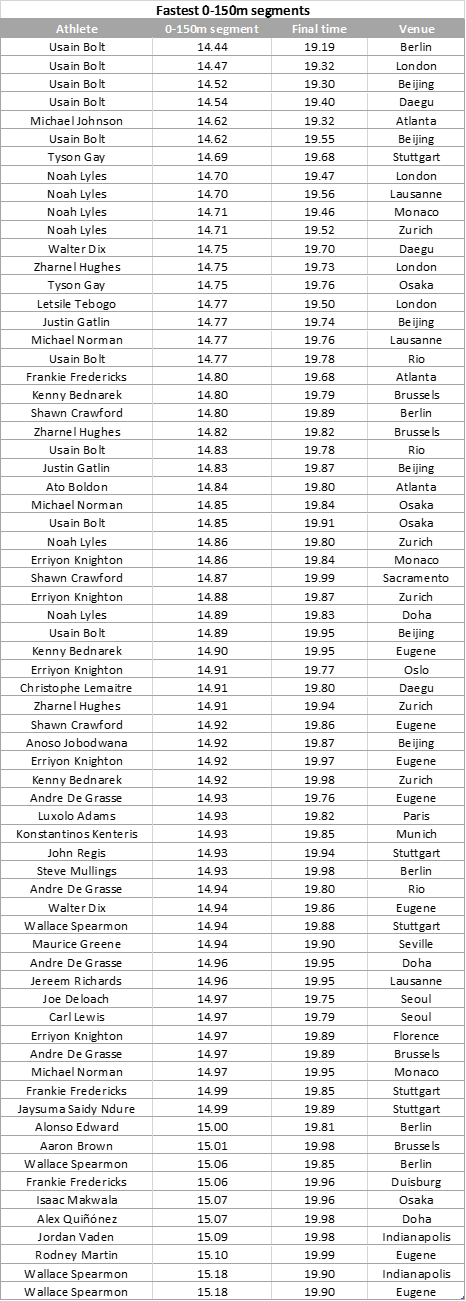
Out of the performances with available 50m splits there has only been four sub-14.6 splits. All of them from Usain Bolt in his four fastest performances. It is possible that Noah Lyles also had a sub-14.6 split in his 19.31. Based on the 10.07+9.24 splits my guess is that the two last 50m splits looked something like 4.51+4.73 or 4.52+4.72 which would put the 150m split of Lyles at 14.58 or 14.59.
Based on
his 100m splits (10.14+9.12) Yohan Blake was likely very close to a sub-14.6
split in the 19.26 performance. My guess is that his last two 50m splits were
either 4.46+4.66 or 4.47+4.65 which would put his 150m split at 14.60 or 14.61.
Even when
including straight track performances there has only been an additional six sub-14.6 splits. Two from Usain Bolt (14.35 in 2009 and 14.42 in 2013), two
from Tyson Gay (14.41 in 2010 and 14.51 in 2011) and two from Noah Lyles (14.41 in 2024 and 14.56
in 2023). If the straight track 150m and 200m distances would be more
frequently run sub-14.6 performances would likely be somewhat more common but
considering that Walter Dix ran a 14.65 straight track 150m with a +1.4
tailwind when he was at his absolute peak it is clearly very difficult to go
sub-14.6 even in a straight track 150m race. Doing it on a curved track in a
200m race is therefore obviously a truly outstanding feat and it really puts
into perspective how flawless the first 150 metres of Lyles 19.31 performance
was and also how remarkable Bolt's four curved track 150m splits in the
14.44-14.54 range are.
Here are
the fastest 50-200m segments from performances with available 50m splits.
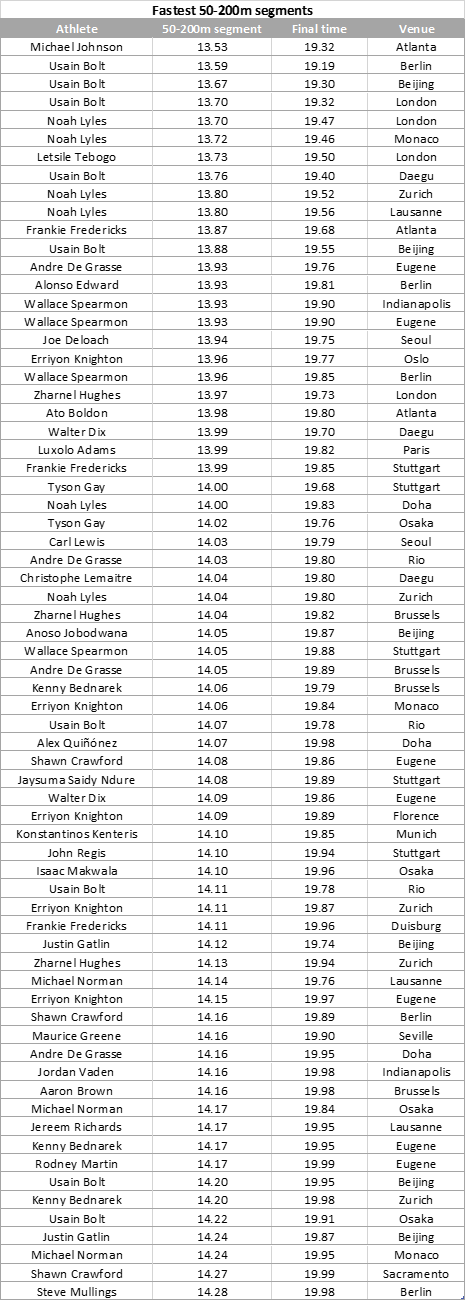
Out of the performances that were included in this study there has only been two sub-13.6 splits (Johnson 13.53 and Bolt 13.59). Yohan Blake certainly had a sub-13.6 split in his 19.26 performance as well though.